Tuning a logo-like
environment
to a knowledge domain
Bojidar Sendov
Faculty of Mathematics and Informatics,
University of Sofia
5, James Bourchier, Sofia 1126
email: bojo@fmi.uni-sofia.bg
Evgenia Sendova
Institute of Mathematics and Informatics, BAS
Acad. G. Bonchev str. Bl.8, Sofia 1113
email: jenny@banmatpc.math.acad.bg
BULGARIA
Abstract
The development of microworlds tuned to
a knowledge domain while retaining full programmability
is reported with the educational experience gained. The
importance of a language-based computer environment in
the pursuit of improved learning is considered. A case is
made that in order to be educationally powerful, the
learning environment should provide flexible tools for
defining new notions as well as expressing, articulating
and experimenting new ideas. These tools should
facilitate problem solving, promote student and teacher
individualization and support clear communications. Some
representative examples are considered in the context of
the latest version of Geomland - a mathematical
laboratory in Logo style, designed, developed and
experimented by Bulgarian researchers. The style of
guided explorations and discoveries has been experimented
with teachers in a broader context in the frames of
teacher training activities under TEMPUS SJEP 07272-94.
Keywords
Geomland,
programmability, explorations, creativity, discovery
learning
My schooling paid too much
attention
to learning what was known and too little
to finding out about what was not known...
Lincoln Steffens
1 Introduction
It has often been claimed that the real craft of the
"maestro-teacher" is to enhance the scientist in the
students, to demonstrate to them situations where one does not
know the answer, even does not know if there is such an answer,
but is ready to take the risk of failure in front of one’s
students. Such a role of the teacher was (and still is) a
dream in most educational systems since it is not easy to train a
student in the technique of discovery. But today one of the
positive effects of IT integration in the educational process is
that it extends the professional dimension of teaching [1] by
supporting the teachers to act as members of a research team.
Indeed, it is difficult to teach the art of problem solving
without engaging oneself in inquiry.
2 Geomland - a land for
mathematical explorations
To create a microworld supporting the exploratory spirit of
the Logo environment and, at the same time, closer to the
traditional geometry curriculum was a challenging task taken on
by a team of Ph.D. students under the guidance of the first
author. Since 1986 they have been developing, and experimenting
with, the Plane Geometry System (now known as Geomland)
-- an educational software which could be considered as a mathematical
laboratory [2]. The coordinate plane is the room where
the laboratory is located and the computer screen is the window
through which experiments are observed. The language of Geomland
is a Logo extension enabling pupils to construct and experiment
with geometric objects, to investigate their properties, to
formulate and verify conjectures, i.e., to discover
mathematics. The Geomland language provides flexible tools
for defining new notions, for expressing and articulating ideas,
something that makes it very powerful from an educational point
of view.
2.1 The first educational experiments
Our experience in integrating Geomland into the
mathematics classes has shown that it is possible to adopt
"discovery learning" -- a style tuned to the natural
wishes of pupils. Experimentation with such a style started at
the beginning of the school year 1989/1990 with the pupils of the
seventh-grade geometry classes at Sofia school Nr 119. The
experiment was led by a Ph. D. student and an experienced teacher
[3,4]. The latter felt free to place more emphasis on the
"mathematical activity" than on "mathematics"
seen as a body of knowledge determined outside of any individual
learner.
A new type of relationship among the participants was
established. The teacher was treated as a consultant. All the
pupils got the feeling of becoming contributors to the
establishment of mathematical facts. Furthermore, they mastered
their mathematical language, since a precise formulation was
necessary to make their definitions workable. With clever
guidance, pupils learned to act like researchers. They carried
out experiments, shared their results, formulated hypotheses,
posed new problems and were motivated to prove their own
theorems... Even if they happened "to discover
America" this was an America of their own [5] and its very
discovering helped them realize what doing mathematics means...
The fact that every activity in Geomland could be
framed in a language (as a procedure of instructions), made it
possible that the geometric solutions could be first analyzed (by
the students themselves) and then discussed by the whole class.
The teacher used a data display system to present the most
interesting approaches on a big screen. She commented on the
different strategies used -- on virtues and shortcomings alike.
Discussions involving the students, their teacher (and sometimes
the researchers present) contributed much to cultivating an
awareness that the Geomland procedures should not be
treated as "right" or "wrong" but rather as
concrete approaches to the solution that could be developed,
improved, generalized, modified.
Of course, the environment itself could not guarantee the
style of teaching we were enhancing. For many teachers (and even
more so - for the future teachers taking their practical
pedagogical exams) the routine of "preaching" was
easier and safer to do. "How do you expect us to teach in a
new way - they would say - if we have experienced at school and
at the university alike mostly the style of Look how clever I
am and what a good solution of the problem I know or Here
are some theorems invented by mathematics geniuses and you should
learn their proofs..." and they were right - the
sterility of teaching mathematics is even more noticeable at the
university level - almost fixed curricula and lecturing, in which
the flavor of mathematical explorations is hardly ever
experienced. To cope with this problem we decided to introduce a
new course for the pre-service and in-service teachers educated
at the Faculty of Mathematics and Informatics at Sofia University
- "Teaching Mathematics in a Laboratory Type
Environment". In a broader context the style of guided
explorations and discoveries has been experimented in the frames
of the teacher training activity under the project TEMPUS S_JEP
07272-94. To give an idea of the working atmosphere of this
course, let us consider an example.
2.2 The Pendulum model - an endless
process of stepwise refinement and enrichment
To build a model of a simple mathematical pendulum in Geomland
was a problem offered at the beginning of the course to
in-service teachers undergoing a retraining program, then to
fourth year students about to become teachers. Below we shall
discuss some of the most typical situations experienced during
the process of problem solving.
The first task was to start with the simplest approximation of
the model - the rod represented by a connected vector (a directed
segment with a fixed initial point) which changes its direction
oscillating about a fixed axis.
OBJECT "T POINT
0 84.
An object named T, which is a point with co-ordinates (0, 84),
is constructed (the fixed point).
OBJECT "ang 60
The angle of deviation ang is initialized as an object on
which the whole construction will depend.
MAKE "length
100
OBJECT "V VECTOR 270+:ang :length
OBJECT "P SEGMENT :T :V
The rod is constructed as a directed segment P representing
the free vector V whose direction makes a 270+:ang angle with the
X-axis and whose length is 100.
To make the rod move it was enough to change the value of
angle ang. This was easily obtained "by hand",
i.e. by executing a number of times the command:
OBJECT "ang
:ang - 10
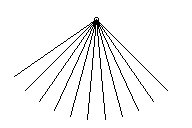
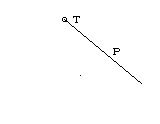 Let us
note that when changing an object in Geomland all the
values depending on it are changed automatically - in our case
the change of ang led to an automatic change of the
objects defined through it, i.e. of V and P. Thus to make the rod
oscillate with an amplitude of 60 degrees it was enough to
execute the above instruction 12 times and then an equal number
of times the following one:
OBJECT "ang
:ang + 10
The next approximation was to achieve an "endless
oscillation" :
WHILE "TRUE
[REPEAT 12 [OBJECT "ang :ang - 10 WAIT 5]
REPEAT 12 [OBJECT "ang :ang + 10 WAIT 5] ]
Though "endless" the solution was not elegant at
all. The students decided to elaborate it by implementing the
following algorithm:
WHILE <a key is
not pressed>
[Keep moving in the chosen direction until the amplitude is
reached and then change the direction]
For the purpose they introduced the parameters maxan g
and anginc for the amplitude (the maximal angle deviation)
and for the angle increment, respectively:
MAKE "maxang 60
MAKE "anginc 10
OBJECT "ang :maxang
...
WHILE NOT RC? [
(IF (ABS :ang) >= :maxang [MAKE "anginc NEG
:anginc])
OBJECT "ang :ang + :anginc WAIT 5 ]
This improvement was just technical (from programming point of
view) but in fact it reflected a bettter understanding of the
pendulum nature - the fact that it deviates only to a
certain angle. The latter approximation was not straightforward
but was preceded by a version in which the pendulum behaved more
like a clock-hand (the students had not realized that the angle
deviation in this model had a sign - a mistake which we as
lecturers welcomed as a source of valuable discussions). Now the
model had become much more one of a pendulum. Should we have felt
satisfied? Yes and No. Of course, there were
students ready to attack another problem...
Let us emphasize at this point that the original Logo paradigm
of letting the learner the initiative for further explorations
does not work properly in a strictly fixed time interval (which
in the case of the school setting is very short in addition).
Therefore when teaching in a real school it is important for the
teacher to sharpen the student’s feeling of being
unsatisfied with the current achievement. We, in turn, also had
to cultivate among the future teachers the need for improvements
and refinements in the process of problem solving:
Wouldn’t it look more natural to make the rod move
towards the axis no matter what the initial deviation is? -
was the next question of the lecturer.
In order to assure a movement in the natural direction
the students found convenient to define the notion of normalized
angle by means of the following procedure:
TO normalized :ang
(IF (ABS :ang) > 180
[OUTPUT normalized :ang - (SIGN :ang)*360])
OUTPUT :ang
END
Now the initial position of the rod could be chosen by random:
...
MAKE "maxang normalized RANDOM 360
...
WHILE NOT RC? [(IF (ABS :ang) >= :maxang
[MAKE "anginc (NEG SIGN :ang)*(ABS :anginc)])
OBJECT "ang :ang + :anginc WAIT 5 ]
The pendulum would not behave properly only in the case of a
vertical initial position (its equilibrium state). To take into
account this situation it was enough to introduce the following
predicate:
TO EQUILIBRIUM? :ang
OUTPUT OR :ang = 0 :ang = 180
END
and then to prevent the rod from moving if it was in
equilibrium initially:
IF NOT EQUILIBRIUM?
:ang [ WHILE NOT RC? [... ]
The only thing left to figure out was how to model the
effect of moderation.
The first suggestion was to introduce a pause whose value
would grow with the absolute value of the deviation (e.g. the
input :t of WAIT could be expressed as a linear function of the
angle). After some considerations the students suggested the
following function:
t = 0.15 * ang
Surprisingly, this expression did not work. First, the
input of WAIT should be a natural number. Besides when the
consecutive values of t were printed it became obvious
that the graph of the function had to be shifted so as to reach a
non-zero minimum pause at a zero angle deviation. After some
adjustments the students produced the following piece of code:
 ...
...
OBJECT "t 2 + ABS ROUND 0.15*:ang
...
WHILE NOT RC? [ (IF (ABS :ang) >= :maxang
[MAKE "anginc (NEG SIGN :ang)*(ABS :anginc)])
OBJECT "ang :ang +
:anginc WAIT :t]
Although the visual effect was satisfactory, the trace of the
rod matched a uniform motion rather than an alternate change
between a moderating and an accelerating one.
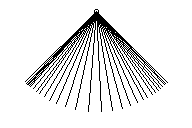 A further, more ambitious, step was to make the
consecutive positions of the rod with an angle increment
decreasing by absolute value. This time the intellectual effort
was greater since the problem seemed almost the same and yet -
upside down. The students were used to investigating
functions and to drawing their graphs, but it turned out
relatively difficult for them to construct a function with given
properties. Eventually they produced the final (for that
particular session) version of the model:
MAKE "angincmax 8
MAKE "angincmin 1
MAKE "maxang normalized RANDOM 360
OBJECT "ang :maxang
OBJECT "V VECTOR 270+:ang 100
OBJECT "P SEGMENT :T :V [TRACED]
MAKE "k (:angincmax - :angincmin)/:maxang
OBJECT "anginc :angincmax - :k*(ABS :ang)
MAKE "d (NEG SIGN :ang)
WHILE NOT RC? [
(IF (ABS :ang) >= :maxang [MAKE "d (NEG SIGN :ang)])
OBJECT "ang :ang + :d*:anginc WAIT 3]
Now the trace left made it clear that this version of the
model was a more realistic approximation of the pendulum.
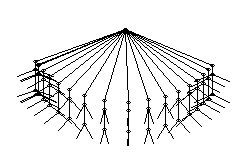 A lot of ideas were left for further explorations -
to apply trigonometric functions when describing the increment of
the deviation, to model a marionette performing exercises at the
end of the rod under a music accompaniment etc.
The informatics instruments were naturally integrated in the
development of the modeling and tuned so as to provide the
necessary counterpoint allowing important mathematical ideas to
stand out sharply.
The students were themselves surprised how difficult it had
turned out to harness the mathematical knowledge (reproduced many
times in standard exam situations) in such a simple model.
The students felt proud of their final achievement and somehow
satisfied to witness the non-simulated difficulties overcome by
the lecturer himself.
During the whole course we considered situations which were
(as suggested in [7 p. 67]) sufficiently concrete (as well as
interesting and soluble) in the hope that students would generate
tasks and sub-tasks for themselves. Soon they realized that the
nature of the problems made the road more important than the
inn...
But there were still cases when the inn itself was the
object of interest. For instance:
2.3 "Where there are problems, there
is life"
Several years ago (at the annual conference of mathematics
teachers in Bulgaria) a colleague of ours brought up a new
(i.e. well forgotten) problem formulated more than 100 years ago
by Ivan Salabashev, a Bulgarian mathematician and politician
whose anniversary was celebrated at that occasion. The problem
read:
Given two circles find the locus of the centers of the
circles which are tangent simultaneously to the given ones.
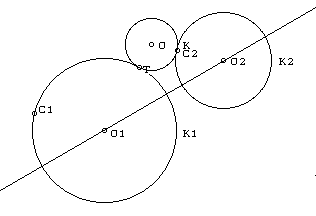 The teacher who proposed
this problem was sincerely interested in the solution since he
had neither managed to solve it nor found a documented one. Thus
he threw the gauntlet to the audience. Whether it was
because the problem seemed to them old-fashioned or too time
consuming but the specialists in geometry did not take the
challenge seriously, murmuring something like: "Obviously a
second degree curve..." With a final spark of hope the
investigator of Salabashev’s works asked us to investigate
the problem in Geomland. Here follows the visualization of
our construction (a more detailed exposition is given in the
Appendix):
Even the very construction of a circle tangent to two given
circles turned out to be interesting and rich of approaches. The
approach we chose made use of geometric facts taught at 8th
grade (the first year of the secondary school). In order to make
the description of the construction closer to the language used
by the teacher we defined several new notions such as
OTHER_POINT, SYMLINE (the procedures are given in the Appendix).
An additional challenge was to:
- generalize the construction, i.e. to make
it independent of the initial mutual position of the two
circles;
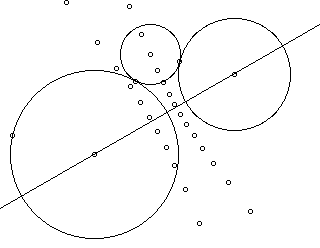 parametrize the construction in such a way that
when changing the parameter the constructed circle would
preserve its property of being tangent to the given
circles. As a consequence, the dynamics of the locus
construction could be easily followed since the
consecutive points of the locus were in fact the
consecutive values of a point (the center of the third
circle) whose visualization could be controlled
appropriately in the frames of the REPEAT instruction
(see the Appendix).
To see the properties of the locus we made use of the fact
that it is an object (a data type SET of points) that can be
investigated - its elements can be selected and checked for some
properties. In this case the difference of distances from any
point of the locus to the two centers turned out to be equal to
the sum of the two radia. The measurement could be done directly
(with printing in a cycle the consecutive differences) or with a
Logo-like predicate (PROP_HYPER? in the Appendix). Furthermore,
we could checked if all the points of the locus obtained were
coincident with the conic section passing through 5 of its points
(arbitrarily chosen).
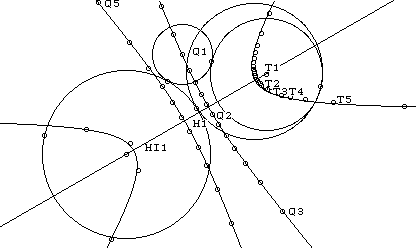 The teacher seemed satisfied at first glance, but at
second... "What if the tangent circle touches one of the
given circles internally?" he asked. "And does the
result depend on the mutual positions of the given circles?"
To answer these questions we had to revise the program by
adding a second tangent circle and to study in parallel the two
loci for different distance among the given circles.
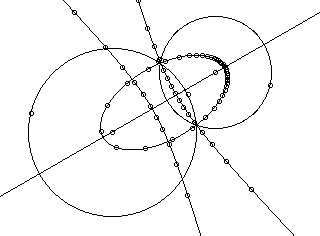 As seen from the figures below the two loci
obtained in the case of intersecting circles turned out to be a
hyperbola (for the externally tangent circle) and an ellipse (in
the case when the circle is tangent externally to the first and
internally to the second circle).
At that time some geometers passed by and started conjecturing
what would happen if the given circles are tangent or are one
inside the other. In search of completeness they hoped for some
degenerated curve in the case of tangent circles or for a
parabola at least, but their expectations were not justified.
Other conjectures arose concerning the particular cases
generating a locus which is a circle.
The result being of interest for its sake, was not the
greatest satisfaction achieved. The richness of ideas for
constructions and explorations, the necessity of making the
construction both universal (independent of the mutual position
of the circles) and exhaustive (embracing all the tangent
circles), as well as the endeavor to make the description
readable for mathematicians with different background made us
return to Salabashev’s problem at different occasions. A lot
of similar experiences convinced us that professional
mathematicians can also get insight when playing in exploratory
environments and can suggest ideas for further investigations
thus sharing with the students the joy of the discovery and
possible failures alike.
3 Some reflections
3.1 On Pedagogy
The educational philosophy behind the design of Geomland
has been to provide facilities for connecting the necessity of
precise discourses with the surrounding world. In order for such
a need to be felt the object modeled should live - it
should react, it should allow tinkering, since meanings
are reshaped and recreated in action [7 - p.131] Furthermore,
the action with things as well as the focusing on the thing
itself is based on the use of a programming language. They say
that using a programming language means to have the courage of
admitting your own mistakes. On the other hand mistakes are
welcome in a language based environment for two reasons at least:
- they reflect very well the misconceptions
of the learner since the way of verbalizing his/her
understanding about a certain concept is recorded and
therefore can be reflected upon. (As a consequence the
thinking process itself becomes an object of analysis and
exploration.)
- they enable us to demonstrate different
styles of debugging - a process much more educationally
powerful than demonstrating just an errorless solution.
Though the details, and the need for precision, may be
specific to mathematical communication, the same expressive
skills are important in communication in a broader sense - one
must be able to express ones overall meaning in a non-technical
way, and one must be able to add precision in a variety of ways -
just as the piano-tuner plays around every single pitch until
perfect harmony is achieved
It is the divine inspiration (often a feed back to the
audience) that can help overcoming the boredom of lectures in
which every little step is known in advance. But in order to feel
free to improvise it is crucial for the teacher to have a
computational environment that is built appropriately.
3.2 On Software design
We shall concentrate on one of the many problems concerning
the educational software design. When the software is being tuned
to a certain domain the properties of this domain are built into
the software together with artifacts determined by the
designers’ choice. In the latter case the educators should
be aware of the danger that the students might
"discover" postulates which are not part of the
postulate set of the given domain. This is true for many
geometric applications. As stated in [6] further research is
needed to clarify what students do notice, and how they do
interpret what they see. Furthermore, most of the existing
systems reflect two main trends: either they offer everything
which reduces their educational power, or adding a new
property involves programming and thus makes it rather
complicated for the teachers.
The central idea when designing Geomland was to open up
to the learner the expressive power of programming as a means to
navigate and reconstruct a domain. In other words it has been
developed with the ambition of being rich enough for explorations
and enabling different approaches to be tested, modified,
developed and compared; an environment which, though artificial,
would admit real experience to be recorded with all its failures
and successes
The goal of our next version (Research Logo System [8])
is to provide learners with such facilities that they could build
the new notions as objects (together with their properties and
operations on these objects), similarly to the way a particular
mathematical domain is built upon the minimal set of axioms. This
process, although achievable in Geomland, is rather clumsy
from technical point of view since it is not tuned enough to the
genuine style of the Euclidean geometry. Our greatest endeavor is
to make the style of reconstructing the domain in full harmony
with its proper style, i.e. to provide the whole range, from easy
means for making sketches up to means enabling construction of
arbitrarily complex tools. Such a continuity might be best
achieved by integrating direct manipulation interface with full
programability (see also [9]). Once this is achieved, the
computational environment can become a particularly fruitful
domain, a setting where we may see the externalized face of
mathematical objects and relationships through the window of the
software and its accompanying linguistic and notational
structures. [7 - p.125]
4 Conclusions
The role of new technologies in education is not only to
require a new competence from the teachers but to provide them
with environments rich enough to enhance the explorer in them and
in their students alike. When tuned to a specific domain, such
environments can bring into the classroom the spirit of the
subject matter as a science. Our experience at a school and
university level has some optimistic examples of mathematics
experienced as a field where problems without known answers
exist, other problems wait for the teachers and/or the pupils to
formulate them and then to act together as a research team.
Hopefully more teachers will gain the self-confidence to lead the
pupils to the unknown; to cultivate in them the spirit of
adventure and make them understand that although open the
computer environment is not a jungle where they could be lost.
References
- Hodgson B., The Roles and the Needs of
the Teacher, in David Tinsley and Deryn Watson (Eds.)
Integrating Information Technology into Education - IFIP
WG 3.1 Working Conference, Barcelona, October 17-21, 1994
pp 25-35
- Sendov, B. and Dicheva, D. (1988) A
Mathematical Laboratory Logo Style, in Lovis,
F. and Tagg E.D.(eds.) Computers in Education --
Proceedings of the IFIP TC3 European Conference on
Computers in Education (ECCE’88), Lausanne,
Switzerland, North Holland.
- Kolcheva, M. and Sendova, E. (1992)
Re-inventing the "Elements" in a Logo-based
Environment. EUROLOGOS, vol. 1, England, EC, BD23
1QQ;
- Kolcheva, M. and Sendova, E. (1993) Learning
Rather Than Being Taught: A New Style of Studying Plane
Geometry, in Knierzinger, A., Moser, M. (eds.)
Informatics and Changes in Learning, Proceedings of the
IFIP Open Conference, June 7-11, 1993, Gmunden, Austria
- Sendov, B. and Sendova, E. (1991) Discovering
an America of Your Own. Mathematics & Informatics
Quarterly, December 1991, vol. 1, No. 3.
- Goldenberg E. P. and Cuoco A., What is
Dynamic Geometry?, Educational Development Center,
Inc. 1996
- Noss R. and Hoyles C., Windows on
Mathematical Meanings: Learning Cultures and
Computers, Mathematics Education Library, Kluwer
Academic Publishers, 1996
- Boychev P., Overview of Research Logo
System, in Proceedings, 8th International
PEG Conference, Meeting the Challenges of the New
Technologies. May’97, Sozopol, Bulgaria
- Eisenberg, M., Creating Software
Applications for Children: Some Thoughts About Design, in
A diSessa, C. Hoyles, &R. Noss (Eds.), Computers and
Exploratory Learning (pp. 175-196). Berlin: NATO. 1995
Appendix
Salabashev’s problem in Geomland
INITMEMO
; the memory is initialized
MAKE "dist 30
MAKE "R1 120
MAKE "R2 80
; the distance between the two circles and the lengths of
their radia are chosen
OB "LO LINE POINT 0
0 30
; An object named LO, which is a line passing through the
point (0,0)
; and making a 30 degrees angle with the X-axis is constructed
(OB stands for OBJECT)
OB "O1 POINTON :LO
NEG (:R1 + :dist/2)
OB "O2 POINTON :LO :R2 + :dist/2
; Points O1 and O2 on line LO are constructed at a distance
:R1+:R2+:dist
OB "K1 CIRCLE :O1
:R1
OB "K2 CIRCLE :O2 :R2
; circles K1(O1,R1) and K2 (O2,R2) are constructed
OB "t 167
OB "C1 POINTON :K1 :t
OB "C2 POINTON :K2 :t
; points C1 and C2 are constructed on the circles K1 and K2
respectively so that
; the radius vectors O1C1 and O2C2 are parallel
;(making an angle of t degrees with the X axis)
; (C2 will be the tangent point of circle K2.)
OB "S ISEC :K1 LINE
:C1 :C2
OB "T OTHER_POINT :C1 :S
; the point of intersection of circle K1 and the line passing
through C1 and C2 which is
; different from C1 is constructed by means of the OTHER_POINT
procedure defined below
; (T will be the tangent point of circle K1.)
OB "O ISEC (LINE
:O2 :C2) (SYMLINE :T :C2)
; the center O is constructed as intersection point of the
line passing through O2 and C2 and
; the symmetry line of T and C2 (the bisector of the segment
from T to C2 perpendicular to it)
OB "K CIRCLE :O :T
; circle K externally tangent to K1 and K2 is constructed
OB "D2 POINTON :K2
:t + 180
OB "DS ISEC :K1 LINE :C1 :D2
OB "DT OTHER_POINT :C1 :DS
OB "DO ISEC (LINE :O2 :D2) (SYMLINE :DT :D2)
OB "DK CIRCLE :DO :DT
; similarly circle DK tangent externally to K1 and internally
to K2 is constructed
MAKE "st 10
HISTORY "H :O
TRACED [O DO]
REPEAT 360/:st [OB "t :t + :st]
; the center O changes automatically since it depends on t .
Thus 36 consecutive positions of
; O are constructed. They can be traced (the trace of their
images just being visualized)
; or collected in a set ( H ) as objects to be manipulated
with.
OB "PH POLYGON :H
; the points of the set H are connected with a polygon line
OB "T1 ITEM 1 :L
OB "T2 ITEM 6 :L
OB "T3 ITEM 12 :L
OB "T4 ITEM 15 :L
OB "T5 ITEM 18 :L
OB "LOCUS1 CURVE :T1 :T2 :T3 :T4 :T5
; Five points belonging to the locus are selected and a second
degree curve is constructed
; through them
OB "FL FOCUS
:LOCUS1
OB "F1 ITEM 1 :FL
OB "F2 ITEM 2 :FL
POINTON? :O1 :F1
POINTON? :O2 :F2
; The foci of the curve are selected and checked for
coincidence with the centers O1 and O2
TO OTHER_POINT :T :S
(IF (TYPE :S) = "POINT [OUTPUT :T])
OUTPUT IF POINTON? :T FIRST :S [LAST :S][FIRST :S]
END
; For a point T and a set S which consists of two points the
procedure outputs the other point belonging to S.
TO SYMLINE :A :B
LOCAL "S
MAKE "S SEGMENT :A :B
OUTPUT LINE POINTON :S 0.5 90 + HEADING :S
END
; For inputs A and B which are points the procedure outputs
the line passing through the
; midpoint of the segment AB and perpendicular to it.
TO PROP_HYPER? :S :F1
:F2
IF (COUNT :S) < 2 [OUTPUT "TRUE]
(IF NOT (DIFDIST FIRST :S :F1 :F2)= DIFDIST FIRST BF :S :F1
:F2
[OUTPUT "FALSE][ OUTPUT PROP_HYPER? BF :S :F1 :F2])
END
; For inputs S (a set of points) and F1, F2 (points) the
procedure outputs TRUE if all the
; elements of S have the property of the hyperbola, i.e. if
the difference of the distances from
; any of them to two given points (F1 and F2) is constant.
TO DIFDIST :P :F1 :F2
OUTPUT (DISTANCE :P :F1) - DISTANCE :P :F2
END
; The procedure outputs the difference of the distances from
point P to F1 and F2.
TO PROP_ELLIPSE? :S :F1
:F2
; similar to PROP_HYPER?
END
TO SUMDIST :P :F1 :F2
; similar to DIFDIST
END
 Let us
note that when changing an object in Geomland all the
values depending on it are changed automatically - in our case
the change of ang led to an automatic change of the
objects defined through it, i.e. of V and P. Thus to make the rod
oscillate with an amplitude of 60 degrees it was enough to
execute the above instruction 12 times and then an equal number
of times the following one:
 ...
... A further, more ambitious, step was to make the
consecutive positions of the rod with an angle increment
decreasing by absolute value. This time the intellectual effort
was greater since the problem seemed almost the same and yet -
upside down. The students were used to investigating
functions and to drawing their graphs, but it turned out
relatively difficult for them to construct a function with given
properties. Eventually they produced the final (for that
particular session) version of the model:
 A lot of ideas were left for further explorations -
to apply trigonometric functions when describing the increment of
the deviation, to model a marionette performing exercises at the
end of the rod under a music accompaniment etc.
 The teacher who proposed
this problem was sincerely interested in the solution since he
had neither managed to solve it nor found a documented one. Thus
he threw the gauntlet to the audience. Whether it was
because the problem seemed to them old-fashioned or too time
consuming but the specialists in geometry did not take the
challenge seriously, murmuring something like: "Obviously a
second degree curve..." With a final spark of hope the
investigator of Salabashev’s works asked us to investigate
the problem in Geomland. Here follows the visualization of
our construction (a more detailed exposition is given in the
Appendix):
 parametrize the construction in such a way that
when changing the parameter the constructed circle would
preserve its property of being tangent to the given
circles. As a consequence, the dynamics of the locus
construction could be easily followed since the
consecutive points of the locus were in fact the
consecutive values of a point (the center of the third
circle) whose visualization could be controlled
appropriately in the frames of the REPEAT instruction
(see the Appendix).
 The teacher seemed satisfied at first glance, but at
second... "What if the tangent circle touches one of the
given circles internally?" he asked. "And does the
result depend on the mutual positions of the given circles?"
 As seen from the figures below the two loci
obtained in the case of intersecting circles turned out to be a
hyperbola (for the externally tangent circle) and an ellipse (in
the case when the circle is tangent externally to the first and
internally to the second circle).