
Research projects in Logo
for high school students
(ages 14-16)
Alexandra Yudina
Institute of New Technologies of Education,
Moscow school No. 57
home address: 7, Kuusinena, apt. 95,
Moscow, 123308, Russia,
tel: (7095) 943-0570,
email: udina@int.glasnet.ru
Abstract
The high school informatics curriculum can be based on Logo environments. Special system of tasks enables students to master such Logo features as procedures and functions defining, recursion, list representation and list processing. These Logo tools enable students to fulfil rather complex research projects on math and physics. Three projects are described in brief and one in details. All the projects are made in LogoWriter.
Keywords
Research project, Logo in high school, integration of school subjects
1 Introduction
Many teachers of informatics in Russian schools use Logo. In most cases they apply Logo in their work with 5-7-graders (10-12 years old). The aim is to introduce students to programming, computer graphics and animation. At this age students have usually one computer lesson a week and their Logo-work rarely continues more then two years. So both students and teachers do not master important and powerful Logo features. They become familiar with the turtle geometry only and therefore Logo is often considered as environment for little ones.
I’d like to describe another method of using Logo at school when the environment is in the center of high school informatics curriculum. Three year course of informatics for 8-10th forms (ages 14-16) is based upon a special system of tasks. This system had been worked out during several years of my pedagogical Logo practice; then a textbook was written. The textbook contains about 200 tasks from turtle geometry to list representation and processing, the tasks complexity and difficulty increasing step by step. So the curriculum enables students to master powerful programming tools and apply them in various situations. There are close connections between this informatics curriculum and school geometry, algebra and physics. For instance, working with one section students make program that draw graphs of functions. Another section enables students to build computer models of different kinds of motion.
Most of the tasks engage students in making a small research. Usually the students are not given any ready-made solutions. Learning about this course students become familiar with elements of research activity (building and investigating computer models). And the teacher gets an opportunity to develop the students research activity in another way. When being at 9-10th grade some of the students are offered themes for long duration research projects in Logo. Then they are working on their projects during the school year and they make reports about their work for their class-mates and teachers at the end of it.
During last three years more than 20 students have made such "school investigations" under my guidance. Some of the students have fulfiled research projects for two or three times, the difficulty and the size of works increasing year by year, the outcomes becoming more and more interesting. After three year practice I can conclude that such activity isn’t easy for students but lies within their powers. It is something new and interesting for them. Most of the students were not strong at math and physics. While engaged in investigating activity students changed their attitude to school subjects (to some extent, of course). But the main aim is to develop students cognitive abilities and motivation.
Typically every student work is built in three stages. Firstly, the model must be built (the Logo-program must be created). Then the model becomes an object of research. The student runs the program with different sets of actual parameters. Then he or she collects and interprets data of investigation. The outcomes (graphs, numbers) are to be analyzed. Students hypothesize possible relationships between inputs and outputs; confirm regularities. The last stage is making up a report with formulas, illustrations, graphs; and preparation of 10-15-minute lecture with computer demonstration. Logo gives a wide variety of tools for all these activities.
The list of themes for research projects is growing year by year. Most of them are reckoned on LogoWriter; the rest — on Lego-Logo (Control Lab). Some of the themes were offered by school teachers. When a student and I discuss a theme for his or her project, math or physics curriculums are always taken into consideration.
Four research projects are described in the next paragraphs. Three projects (for 9th grade) are described in brief and one (more complex, for 10th grade) in details.
2 Building models of motion without using formulas
To build a computer model of a body motion without using formulas (such as H=gt2/2) one may apply the following method. The process may be considered as a sequence of small steps having one and the same duration in time. And a body shift during each period may be described by a recursive procedure.
| to move1 :Vx setx x + :Vx move1 :Vx end |
to move2 :Vy :g sety y + :Vy move2 :Vy + :g :g end |
to move3 :Vx :Vy :g setx x + :Vx sety y + :Vy move3 :Vx :Vy - :g :g end |
Procedure move1 is a model of uniform motion in a straight line (along X-axis). Let the period needed for each loop be a unit of time. Then the variable Vx will be the speed of the turtle.
Procedure move2 is a model of accelerated motion (along Y-axis). During every loop (i. e. agreed unit of time) the turtle shift (that is turtle speed) increase by a fixed value g (or decrease if g < 0). So g is the turtle acceleration.
If a model of some complex motion is to be built one can make use of the superposition principle. As we consider a very small time period we can describe a set of shifts corresponding to component motions. For instance, procedure move3 is a model of motion in the field of gravitation (when two previously described motions are "summarized"). In fact, the elementary actions are produced consequently. But duration of any loop is very small, so we’ll see the turtle executing both of component motions simultaneously. The described method allows to build a model of any complex motion if only we are able to resolve the motion into components and to describe an elementary shift of each component motion.

Figure 1 Motion in the field of gravitation
Figure 1 shows the influence of the starting speed angle on the "range" of the turtle. The maximum range is reached if the starting angle is equal to 45 degrees.
The next example is a model of superposition of two accelerated motions along X-axis and Y-axis.
to move4 :Vx :a :Vy :g
if (or x > 290 x < -290 y > 160 y < -160) [stop]
setx x + :Vx
sety y + :Vy
move4 :Vx - :a :a :Vy - :g :g
end
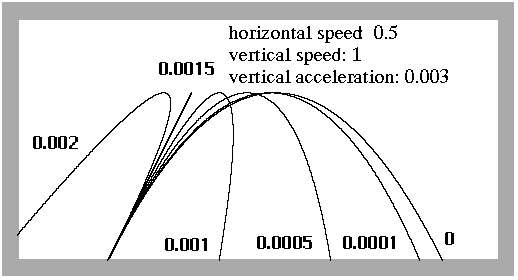
Figure 2 Superposition of two accelerated motions along X-axis and Y-axis
Figure 2 shows how the turtle trajectory changes with altering of horizontal acceleration (horizontal and vertical speeds and vertical acceleration remaining constant). Maximum height is constant for all the trajectories. The smaller the horizontal acceleration the smaller the difference between the trajectory and a parabola. There is some interesting trajectory — the turtle comes back just into the starting point.
3 Models of oscillations
When a body moves due to the force of elasticity its acceleration is: a=-(k/m)x (coefficient k depends on spring or elastic band characteristics, m is the mass, x is the displacement of the body from equilibrium).
Thus a model of oscillating motion along Y-axis is:
to oscillate1 :Vy :b
sety y + :Vy
oscillate1 (:Vy - :b * y) :b
end
This procedure has two inputs: Vy is the starting speed; b characterizes the oscillating system properties. The turtle will oscillate near the axis of abscissae.
Several interesting models of complex motions can be built and investigated if oscillation is one of component motions.
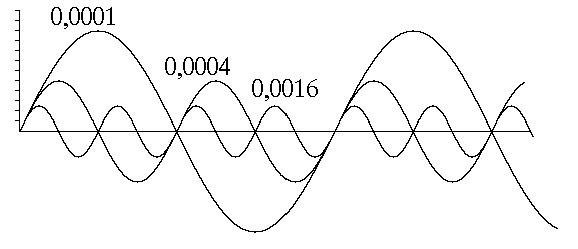
Figure 3 Superposition of oscillation along Y-axis and constant speed straight forward motion along X-axis
Figure 3 shows how the oscillation frequency and amplitude depend on a value of coefficient b (the starting speeds remain constant).
The next example is a model of superposition of two oscillations along axes.
to oscillate2 :Vx :b1 :Vy :b2
setx x + :Vx
sety y + :Vy
oscillate2 (:Vx - :b1 * y) :b1 (:Vy - :b2 * y) :b2
end
There are four inputs in this procedure. A variety of four value sets gives a whole range of interesting and beautiful curves thus providing many problems to explore. For instance, if b1=b2 then the turtle trajectories turn into ellipses.
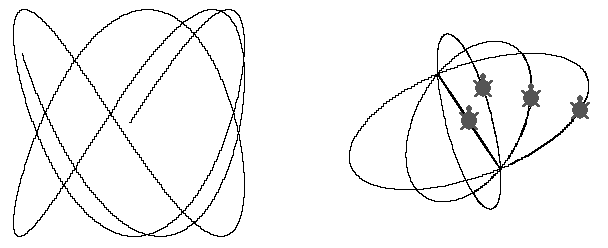
Figure 4 Superposition of two oscillations along axes
Figure 4 (right) shows how the ellipse form depends on the turtle starting position.
4 Recursion and fractals construction
There are procedures with multiple recursive calls the object of research in this project. Such procedures can produce trees, snowflakes and other sophisticated curves. Any of these curves can also become an object of investigation. For example, one can investigate a class of tree-drawing programs. The form of a tree depends on a lot of factors: starting length of branch, limit length of branch, angles between branches, number of recursive calls (it determines how many branches "grow" from every node), and so on.
|
Figure 5 The result of tree 100 3 command |
|
|
Figure 6 The result of snowflake 200 5 command |
|
In case of snowflakes the total length increase can be investigated. More difficult but interesting and useful work is comparing structures of procedures and finding out their resemblance.
5 Electrostatic field picture construction
In this year our store of themes has been enriched with a new and very interesting one (due to our physics teacher) – a few point charges electrostatic field picture construction. This theme was chosen by three 10th grade students in connection with this grade physics course. I did not know about final results and was not sure even in our success. All students worked in different ways: they had different ideas, different programs, different results. I had got my own results, and they were somewhat unexpected. It seems to me that this project is a good illustration of the very idea of educational-research activity. Not practical studies, but such a work which result is unknown beforehand.
We cannot see electric fields. They usually are depicted with conventional lines. Individual point electric charge field is described with two quantities in each point: intensity (it is a vector) and potential (it is a scalar value). An intensity vector is directed towards the charge or from it (in dependence of charge sign), its module is: E=k|q|/r2 (coefficient k depends on units system, q is the charge, r is the distance from a given point to the charge). The potential is: f=kq/r. An equipotential surface is a multitude of points with equal potential; an equipotential line is formed at intersection of an equipotential surface with the plane in which we construct the field picture.
If the field is created with a few charges, we may use a fundamental superposition principle. When we have to find out an intensity or a potential in some point we can calculate the value from the first charge forgetting about the others, then — from the second, etc. And at last we must add them up.
A field line passes so that in each point an intensity vector is directed along the tangent. Field lines and equipotential ones intersect at right angle. All these facts are from the 10th grade physics curriculum.

Figure 7 Field lines, equipotential lines and their superposition (all the pictures are drown by the turtle)
5.1 One field line construction
How one can use the turtle for a field line construction? Let us determine a total intensity vector direction in the point where the turtle is. Let the turtle move on a bit in this direction — say one step. Then in a in the turtle’s new position we’ll find an intensity vector direction again and move the turtle, etc. As a result we’ll get bit-linear approximated picture of a field line.
So the first problem is vectors adding up. It may be solved in different ways. In the first way, we may construct a polygon of vectors (i. e. lay each following vector from the proceeding one) and then connect the beginning of the first vector with the end of the last one.


Figure 8 Intensity vectors adding up Figure 9 Vectors polygon construction
Let each charge be determined with a list of coordinates and the charge magnitude (for example [[-50 0] -1]). Then we may define the function of intensity vector calculating in the point where the turtle is:
to E :z
op se 100000 * (abs last :z) / sqr distance first :z
ifelse (last :z) < 0 [towards first :z][180 + towards first :z]
end
The result the function E output is a list consisting of module and direction of the vector. There are two auxiliary functions using in the previous definition — of involution to the square (sqr) and of absolute value (abs). Their definitions are omitted.
Let arrangements and magnitudes of the charges be stored as a list in the variable named list. The simplest way to do this is to run an assignment statement. For example, the following statement corresponds to figure 8: make "list [[[-50 0] -1] [[50 0] 2]] (there are two elements in this list, they represent two charges).
But of course it is more convenient to write a special procedure using dialog or mouse. The total vector determination function is (the turtle constructs a polygon of vectors):
to E_sum :list
make "n 1
make "start pos
make "finish :start
pu repeat count :list [setpos :start
make "V E item :n :list
setpos :finish
seth last :V fd first :V
make "finish pos
make "n :n + 1]
setpos :start pd
op se distance :finish towards :finish
end
Now we can start field lines depicting. For example, to get a 100 turtle steps fragment of line it’s enough to run next statement: repeat 100[seth last E_sum :list fd 1]
However during the checking an unpleasant circumstance has been discovered: near the charges the field lines behave "incorrectly". It turns out that at the coefficient in the formula being equal to 100000 the vectors polygon constructed near the charges does not go in the screen limits. The result of vectors summarizing becomes wrong thus causing gross distortion of the picture. But if we diminish the coefficient then far from the charges (near the screen limits) the vectors modules become too small and can turn into zero (because of rounding error) thus also leading to (causing the) distortions of the picture. So the geometrical method of vectors adding up has limitations. This forces us to turn to another method of vectors adding up – that is expansion of the vectors by axes and adding up their projections. In fact it is very useful for students. Formal methods usually cause difficulties; it’s important for a teacher to demonstrate formal methods advantages in a concrete case, in practical application. Besides, it’s interesting to compare the results reached with different methods so checking warrants reliability.
Thus, to add up a few vectors it is not inevitable to draw them. We may calculate their projections on the axes, then add up the projections on each axis and the reached two projections will determine the total vector. If the vector is the list consisting of the module and the direction, then the projections calculation function may have the following form:
|
Figure 10 Expansion of a vector by axes |
In order to add up some set of numbers (i. e. number list) we may describe following recursive function:
to sum :l
if empty? :l [op 0]
op (first :l) + sum bf :l
end
The calculation of the sums of the vectors-items projections on the axes may be described in the same way:
to E_sum_x :list
if empty? :list [op 0]
op (V_x E first :list) + E_sum_x bf :list
end
to E_sum_y :list
if empty? :list [op 0]
op (V_y E first :list) + E_sum_y bf :list
end
Now the last step we have to do is the total vector module and direction determination (by its two projections). It’s not difficult to find the module using Pithagor’s theorem. But some difficulties arises with the direction. One may use the arctangens function, but it gives a correct result not in all cases (as its magnitude area is from -90 degrees to +90). Usually schoolchildren’s attitude towards trigonometry isn’t very good and towards inverse functions in particular. So when, at last, vector direction determination function has been described correctly and the program begins to draw field lines, it’s perceive as a real victory:
| to arct :a :b op ifelse :b = 0 [ifelse :a > 0 [90] [-90]] [ifelse :b > 0 [arctan :a / :b] [180 + arctan :a / :b]] end |
Figure 11 Different situations when a vector direction is to be calculated |
The total intensity vector is the list of two numbers — the module and the direction:
to E_sum! :list
op se sqrt (sqr E_sum_x :list) + sqr E_sum_y :list
arct E_sum_x :list E_sum_y :list
end
Simple first test may be carried out in the same way that for geometric adding up:
pd repeat 100 [seth last E_sum! :list fd 1]
Field lines "go out" from positive charges and "come into" negative ones or "go to infinity". For drawing process automation it is necessary to provide the turtle’s stop when it reaches any charge or screen limit and also a possibility to draw lines from negative charges (in "reverse" direction). The following logic functions indicate if the turtle has come to some point nearer than 1,5 steps; if it has approached to one of the charges or not; if the turtle has reached the drawing area limits:
to spot :pos
op (distance :pos) < 1.5
end
to charge :list
if empty? :list [op "false]
op or spot first first :list charge bf :list
end
to boundary
op (or x < -300 x > 300 y < -185 y > 185)
end
And, at last, the recursive procedure that draws a field line (from any point) is ready:
to E_line :list :sign
if or boundary charge :list [stop]
seth last E_sum! :list fd ifelse :sign = "+ [1][-1]
E_line :list :sign
end
Inputs for the procedure are a list of charges (with their coordinates and magnitudes) and an agreed sign allowing to draw the line from the positive charge (+) or from the negative one (then the turtle moves along the line in "inverse" direction).
It seems that in given procedure everything is taken into consideration, but experiments with different sets of charges have shown that in the field there may be "singular" points. For example, if the field of two charges of the same name is considered, then there is a point of unstable equilibrium (the intensity is equal to zero in it). If the turtle reaches this point it begins to oscillate near it. It can be said that the created model has given some new, not inherent in the origin, result (not all the field lines end in negative charges or "go to infinity"). After this "discovery" the program was improved.
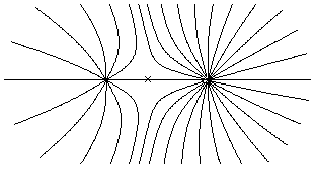
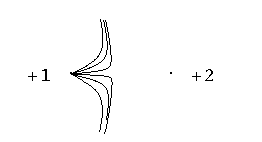
Figure 12 Field lines in the case of two positive charges
The figure 12 shows two charges (+1 and +2). In the marked "singular" point (the left drawing) two field lines meet. The right drawing shows the behavior of field lines near the "singular" point.
If a tired reader hopes that the end of account about the project is already near then he (she) is wrong. We have not reached even the middle yet. However we have not here an opportunity of further continuing in so detailed way as earlier giving all the texts of procedures and functions with commentaries. Further course of the research will be described in broad outline. Therefore it seems to be just the point to draw some conclusions.
Described portion of the project has demonstrated the method of moving forward by small steps. Logo enables students to break a large problem into smaller parts. Then, it might be impossible to get up the results if mastering of Logo-tools (recursive functions, list processing) had not been reached before.
In addition to the students learning about specific concepts, general cognitive abilities developing are also outcomes of such students activity. The skills are: observing and predicting the behavior of objects; identifying important criteria and variables in an investigation; classifying objects or concepts into categories; constructing personal theories from data; experimenting to confirm or disprove a hypothesis.
5.2 The whole totality of field lines construction
Please look at figure 12 (left). The result has been reached by the following method. The lines began near the charges. The turtle started from the first charge 12 times turning every time at one and the same angle (of 30 degrees). Then 24 field lines coming from the second charge were drown by the same method because the physics teacher had explained that the number of field lines had to be proportional to the charge. The drawing seems to be correct. However in some other cases such algorithm leads to contradictory results.
Let us take two charges: -1 on the left and +2 on the right. Let the turtle draw lines (for example 16 ones) from the positive charge. A part of them will come into the negative one. But the angles between them will not be equal (near the charge). So it isn’t clear how we must direct the turtle from the negative charge in order to draw missing lines. Besides it’s seen that the lines number will be more than 8 (this result contradicts the idea that the number of coming into or going out lines is proportional to the charge magnitude). If we begin the process from the negative charge then the drawing results will be different (see figure 13). But the picture of the field lines cannot depend on the charges detour order. So this algorithm is erroneous. More correctly, next assumption is erroneous: near each charge the other charges exercise so small influence that the initial angles between the field lines are equal.
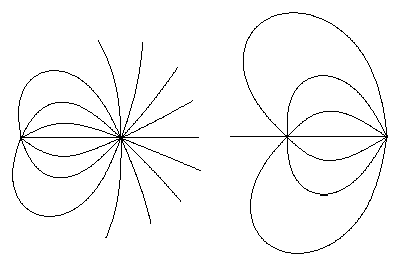
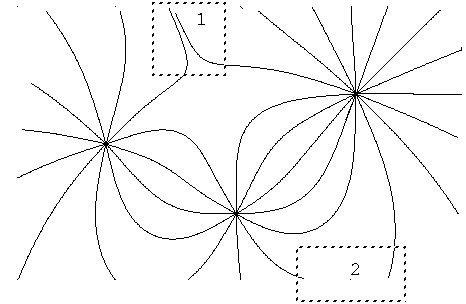
Figure 13 Outcomes of described algorithm depend on the charges detour order |
Figure 14 Irregularities on the field picture |
Attempts to solve this problem have lead to the searches some other criterion for the "correct" set of field lines. The more field intensity the more field lines "concentration" must be. But how the "concentration" can be measured? Probably it is convenient to use equipotential lines for this aim. After all they are always perpendicular to the field lines.
Figure 14 shows one more example of impossibility of getting up a "correct" picture if one begins to draw field lines from charges. At least in two places "irregularities" are seen. In region 1 the field lines are too near to each other; in region 2 an unfitting is seen very well, they are two different lines.
5.3 Equipotential lines construction
When the charges are placed on the screen, it is possible to count the potential from each charge in every point of screen, using the formula f=k q/r. It is much easy, than the vectors adding up. The main problem is in finding points with potential, which is equal to given.
The easiest decision is to scan the screen. Let the turtle moves horizontally and in every step counts the potential and compares it with given. If the potential at the point is equal to the given value, then the turtle will stamp here a dot. When finished with one horizontal, the turtle will move one step vertically and begins with another horizontal. So, after such actions, we will see a great number of dots with equal potential on the screen. The defect of such method is a low speed of drawing process.
The second method was invented by one girl. Her program lets you to "search" the points with given potential using mouse. In the moment the mouse cursor is turned out to be on the point with given potential, the turtle in a shape of colored dot moves to the mouse cursor position and stamps a dot. So we could "develop" an equipotential line, moving the mouse cursor across the screen. It is very interesting and useful to work with this program — because we have to predict how this or that line will pass. But, obviously, it is desirable to automate the equipotential lines drawing process.
The third method makes use of correlation between equipotential lines and field lines. As it known, field lines are always perpendicular to equipotential lines. Let us somehow find one point with the given potential. Then we may calculate the direction of intensity vector in this point (we have also the function) and turn the turtle at right angle to this direction. After this we may move the turtle a little, calculate the total intensity vector direction again ... and so on. The turtle, because of constant moving in perpendicular direction to field lines, must draw an equipotential line. But experiments showed, that the correct lines could not ever been drawn because of "accumulating of error" during the drawing process. The turtle little by little diverged the line with given potential (see figure 15, upper curve). So, it became necessary to improve the program. Let the turtle fulfil a check and a "tuning" after each step. If the difference between current potential and given potential is greater, then needed (this "threshold" difference is to be given at the beginning of the program), it is necessary to return the turtle to the previous position and to change its direction a little. Obviously, it could be necessary to repeat this "tuning" process several times. Figure 15 shows correct result (lower drawing).
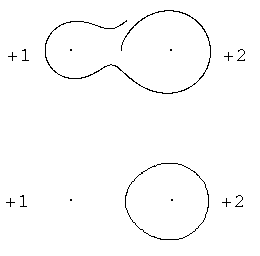

Figure 15 Error accumulating |
Figure 16 Equipotential lines in the case of three charges |
Figure 16 shows the picture of equipotential lines for the same charges set as on figure 14. It looks like a map of a mountain place, doesn’t it? Try to imagine the three-dimensions picture. There must be a peak in the positive charge position, and gaps when negative ones are placed. Where the equipotential lines are very near one to another, the intensity is great, and where some of them passes far from others, the field is weak.
5.4 An equipotential line and field lines coordinated construction
Let us place some charges on the screen and draw any equipotential line. In every point it may be intersected by a field line. So we could draw a field line in two stages — firstly directing the turtle to one side from equipotential line, and then — to another.
| So, the process of field lines drawing will start not from the charges, but from some equipotential line. Now we may use the criterion of accordance between the concentration of field lines and the field intensity in this area. Having drawn up any field line we may return the turtle to the starting point of the equipotential line. Then calculate the intensity vector module and force the turtle to move along the equipotential line a distance proportional to that value. Then draw next field line and so on. |
Figure 17 Field lines drawn from equipotential line |
Here is general and, of course, greatly shortened description of the research. Working on the project students (and I myself) had to develop and apply many mathematical skills. We tried to imagine in own mind such complex objects, as fields. We have consulted many times with school teachers of math and physics. And at least we have realized that some of "school" notions about electrostatic field picture are valid for three-dimension space, but not for flatness.
The project enabled students to understand the inner, deep connection between phenomena; between different areas of knowledge. Students have realized their own abilities to investigate and experiment. And Logo environments are very good for such pedagogical work.